Centre for Samoan Studies
Samoan Armchair Archaeologist
Tutorial - II: Application Layout

CSS-Map
Server
SAA
Main Map
Arch.& Cult.
Heritage
Tutorial


<-- Previous    Tutorial Menu    Next -->


II. Online Application Layout

Below is an example of the basic data recording layout. Each data entry tool is numbered and explained below. For an explanation of the other basic map tools see the LiDAR Map Page Layout section of the Help page in the main Map Server portion of this web site.

•    The Community Input Application contains 9 additional tools:


LiDAR Map Page
Input Application Page


 1.

Overlays
  Menu

 6.

Delete
Features


 2.
Features
  Menu
 7.
Export
Features


 3.
Drawing     
  Tools
 8.
Submit
Features


 4.
Editing
  Tools
 9.
Drawing
Directions


 5.
Feature
  Types


Select an item
to learn more
or
slide down
the page.


<-- Previous    Tutorial Menu    Next -->


1.
The Overlays Menu Overlalys Menu contains the same basic Layer List/Overlays as on the LiDAR Map Page and are activated in the same manner (check mark). The Overlays Menu contains one (1) addition selection, a Survey Grids overlay.
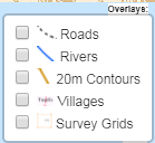
Overlay List

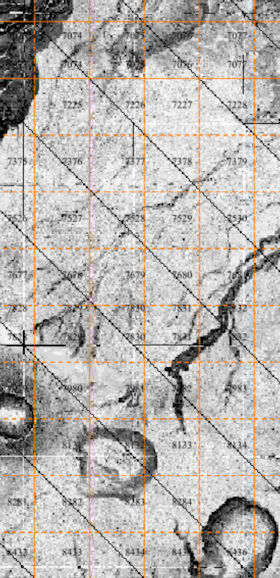
The Survey Grid overlay consists of a grid of orange 500m x 500m squares that cover the islands. Each 500m x 500m square is numbered. The grid is used to designate a specific study area. Grid numbers become progressive larger as you move to the right and down the page.
The exact steps for using the "Survey Grids" is covered in Tutorial III: Find Assigned Study Area.

See the examples of the "Survey Grids" below showing small scale and large scale grids.
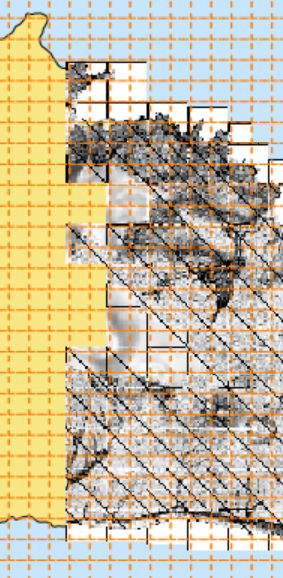
Small Grid      Large Grid

[Back to Input Application Menu]


2.
The Features Menu  Features Menu  is similar to the Overlays Menu, but contains overlays/vectors of the features that have already been recorded on the present map.

Overlay List


See the examples below showing Star Mound and Channel Feature Overlays.

Star Mounds    Channels

[Back to Input Application Menu]


3.
The Drawing Tools  Drawing Tools  displays the 3 basic tools for adding vectors to the LiDAR images.

      1.  Drawing Tools  Polyline - for drawing lines.
      2.  Drawing Tools  Polygon - for drawing polygons (many sided objects).
      3.  Drawing Tools  Circlemaker - for drawing points.

These tools will be covered in greater detain in Tutorial VI: Draw/Edit/Delete.

[Back to Input Application Menu]


4.
The Editing Tools  Editing Tools  displays the 2 basic tools for editing or changing vectors drawn on the LiDAR images.

      1.  Drawing Tools  Edit tool - allows you to edit a vector previously drawn on the screen.
      2.  Remove Tool  Delete tool - allows you to remove a vector previously drawn on the screen.

These tools will be covered in greater detain in Tutorial VI: Draw/Edit/Delete.

[Back to Input Application Menu]


5.

The Feature Type pull down menu  selection allows the selection of the type of feature that is being vectored so that the file name will automaticly be modified with the appropriate extension when it is exported and submitted. To use the pull down menu (see below), simply left click on the selection box  selection  and choose the appropriate feature type from the pull down list.


Feature Type1    Feature Type2    Feature Type3

This tool will be covered in greater detain in Tutorial V: Select Feature Type.

[Back to Input Application Menu]


6.

The Delete Features button DeleteFetures allows you to clear ALL the features/vectors you have drawn on a LiDAR image so that you can start a new submission.
Make sure to save any work you have done before using this tool. The Delete Features button PERMANENTLY DELETES ALL the features/vectors that have been drawn on the LiDAR image.
You CANNOT retrieve work that has been deleted with the Delete Features button !

[Back to Input Application Menu]


7.

The Export Features button Export Fetures saves the features/vectors you have drawn on the LiDAR image to a file in the "downloads" directory of your computer (C:\Users\username\Downloads).
The file name appears in the following format:
      CSS_featuretype_mapsection(#).geojson
         [eg: CSS_Ch_Apata(1).geojson]
After saving, the name of the file appears in the lower left corner of the current web page screen. The ".geojson" (geojason) file is a text file containing information about the vectors that have been drawn. This file can be loaded into QGIS (a free Global Information Systems program that is available at: qgis.org) to display the features/vectors that have been drawn.
The exact steps for completing this critical part of the vectoring process are covered in Tutorial VII: Save/Export features.

[Back to Input Application Menu]


8.

The Submit Features button Submit Fetures allows you to submit the work you have done via email to the Centre for Samoan Studies (CSS). This is a very important final step as it allows CSS to include your work in Utu - the Samoan Archaeology and Cultural Heritage Database for the Independent State of Samoa.
The exact steps for completing this critical part of the vectoring process are covered in Tutorial VIII: Submit features.

[Back to Input Application Menu]


9.
The Directions for Drawing Tools link brings up a short list of directions that reviews the information discussed in the tutorials.

[Back to Input Application Menu]


LiDAR courtesy of MNRE
(C) 2018 Centre for Samoan Studies, National University of Samoa. All Rights Reserved.